How to Measure Impact with an NPS Survey
As part of Bending Spoon’s fast-paced environment and dynamic culture, I recently joined what has become my 4th squad at the company, Quality of Experience (QoX). Because StreamYard has recently undergone a new business repackaging and price increases, it is now even more of a priority to improve user’s perception of the product, and the quality and range of features we offer to stay at the top of our game in comparison to competitors.
How Can We Measure the Impact of QoX?
Of course, the value proposition of QoX is ambitious and slightly risky - how can we justify having a team of developers adding features, most of them for free users too, that will probably only generate tangible increases in revenue in the long run? We have conducted research with a bunch of different cases, as was the case of the user interviews of a past article. But now we needed something more structured and quantifiable, which we could use to display percentual improvements to the bard.
This is when our great data team suggested we implement a Net Prompter Score (NPS) Survey, along with a question about retention and another of their perception of the product in the last month. All of them multiple choice to reduce friction and gage as many users’ opinions as possible.
Building the NPS Survey
We have 3 main questions:
How would you rate your recent experience of StreamYard compared to the past? (Better, worse, same.)
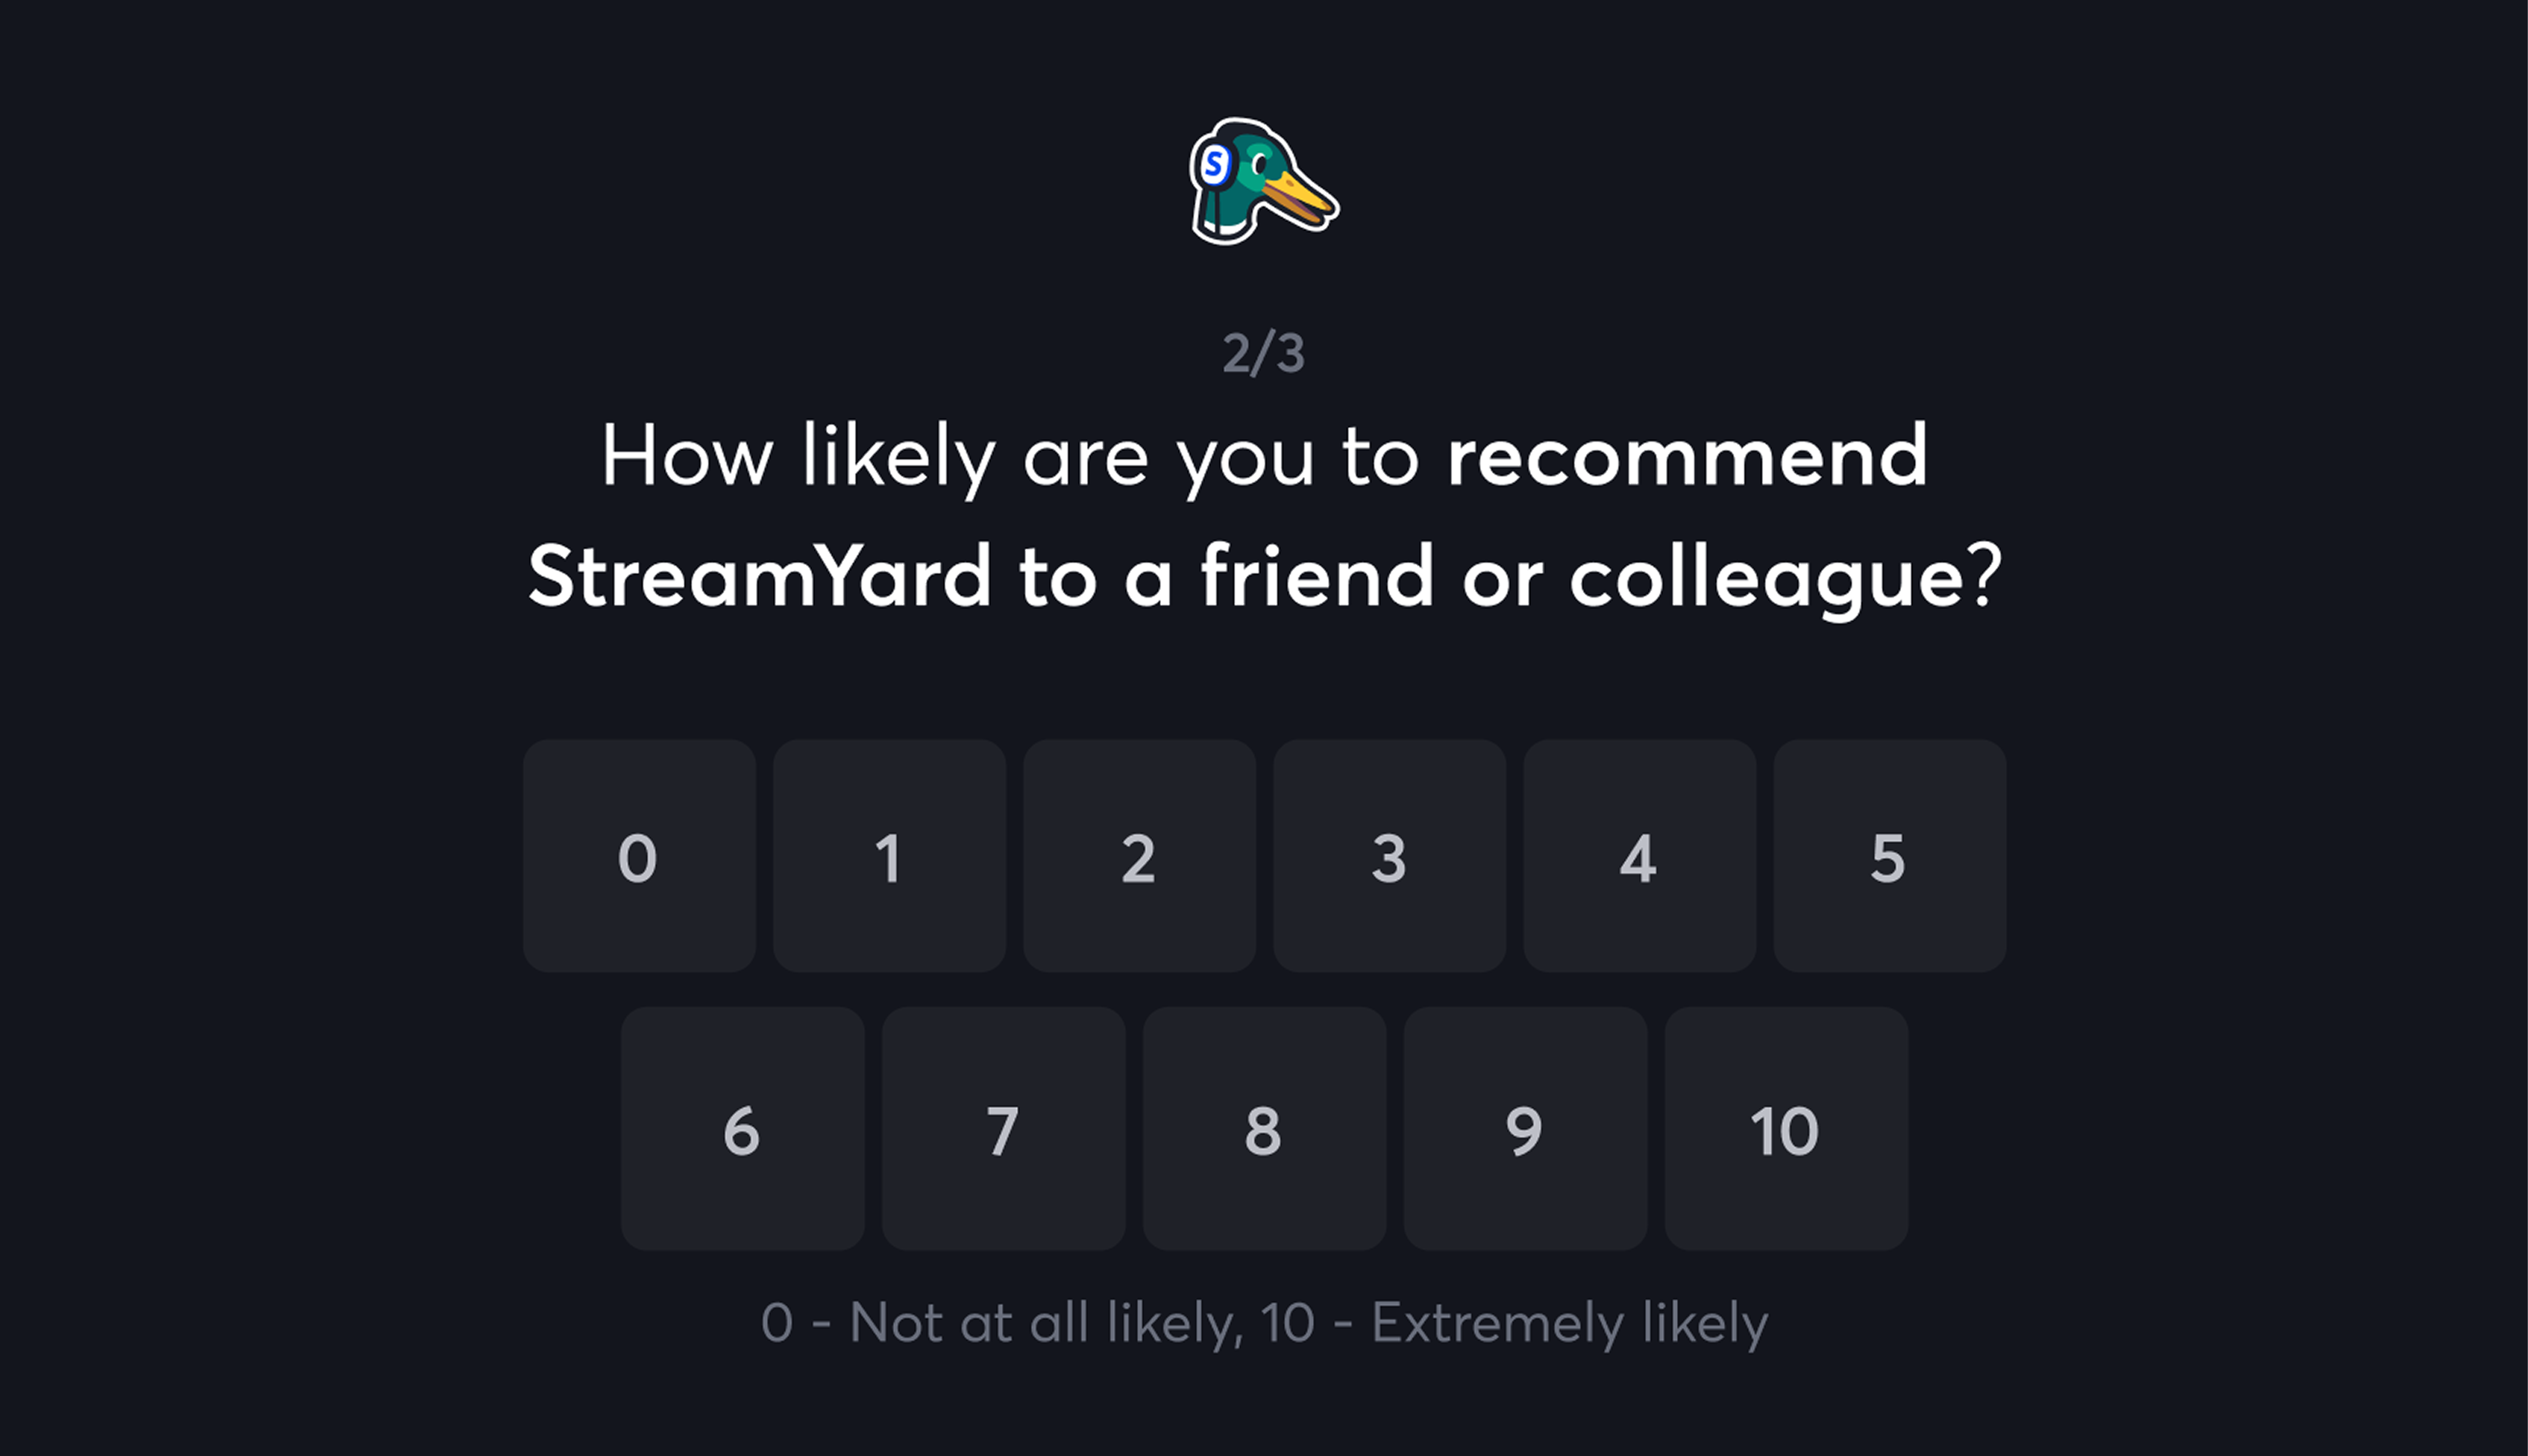
How likely are you to recommend StreamYard to a friend or colleague? (0-10)
Will you keep using StreamYard in the next three months? (Yes, no, not sure.)
And then handling the “thank you” step, and the cleanup in the lifecycle to show the Help button again.
Then we had some conditions:
For new users, only show the survey after the first 30 days to give them time to gether an opinion of the product.
Show the survey every 90 days, so we can analyze the data and our impact each quarter.
Only show the user the survey if they have completed a broadcast since the last survey (30 or 90 days).
If a user dismisses the survey, this counts as handling, so in the same way as submitting, we don’t show it again for another 90 days.
But we needed to spread our sample within the 90 day cycles as much as possible, as to not receive all responses in the first few days and then silence, which could easily lead to biases.
The logic for this was super cool. I finally got the chance to leverage my mathematics degree and use some fun modular arithmetic lol.
1
2
3
4
5
6
7
8
9
10
11
12
13
14
15
16
17
18
19
20
21
22
23
24
25
26
27
28
29
30
31
32
33
34
35
36
37
38
39
40
41
42
43
44
45
46
47
48
49
50
51
52
53
54
55
56
57
58
59
60
61
62
63
64
65
66
67
68
69
70
71
72
73
74
75
76
77
78
79
80
81
82
83
84
const INITIAL_SURVEY_DELAY = 30;
const SURVEY_INTERVAL = 90;

const FEEDBACK_PROGRAM_START = new Date('2025-09-24').getTime(); // 24th September 2025

function calculateCurrentPeriodDay(currentDate: Date): number {
    const totalDaysSinceStart = Math.floor(
        (currentDate.getTime() - FEEDBACK_PROGRAM_START) / (1000 * 60 * 60 * 24)
    );
    return totalDaysSinceStart % SURVEY_INTERVAL;
}

function calculateUserSurveyDay(registrationDate: Date): number {
    const registrationTimestamp = new Date(registrationDate).getTime();
    // Use signup timestamp to deterministically assign a day (0-89)
    return (
        Math.abs(Math.floor(registrationTimestamp / (1000 * 60 * 60 * 24))) %
        SURVEY_INTERVAL
    );
}

const useRecentActivity = () => {
    const userActivities = useSelector(
        activitySelectors.getCompletedBroadcasts
    );

    const hasRecentActivity = useCallback(
        (periodInDays: number): boolean => {
            const threshold = new Date(Date.now() - periodInDays * 24 * 60 * 60 * 1000);

            return userActivities.some(activity => {
                if (!activity.completionDate) {
                    return false;
                }
                const activityDate = new Date(activity.completionDate);
                return activityDate > threshold;
            });
        },
        [userActivities]
    );

    return { hasRecentActivity };
};

export const useShowFeedbackSurvey = (customer: Customer): boolean => {
    const { hasRecentActivity } = useRecentActivity();

    const hasInitialQualifyingActivity = hasRecentActivity(
        INITIAL_SURVEY_DELAY
    );
    const hasActivitySinceLastSurvey = hasRecentActivity(SURVEY_INTERVAL);

    const daysSinceRegistration = getDaysSince(new Date(customer.registrationDate));

    // New users check
    if (
        daysSinceRegistration < INITIAL_SURVEY_DELAY ||
        !hasInitialQualifyingActivity
    ) {
        return false;
    }

    // Previous survey check
    if (customer.lastSurveyDate) {
        const daysSinceLastSurvey = getDaysSince(
            new Date(customer.lastSurveyDate)
        );
        if (
            daysSinceLastSurvey < SURVEY_INTERVAL ||
            !hasActivitySinceLastSurvey
        ) {
            return false;
        }
    }

    // Determine survey display timing
    const userAssignedDay = calculateUserSurveyDay(customer.registrationDate);
    const todayInPeriod = calculateCurrentPeriodDay(new Date());

    // Show survey on or after assigned day
    const isTimeToShow = userAssignedDay <= todayInPeriod;

    return isTimeToShow;
};
So essentially, we show the survey when cycleStartDate - userSignUpDate (mod 90) ≡ currentDate - cycleStartDate (mod 90), and this ensures the data points are spread uniformly in time.
Update: this has now been running for a few weeks. So far we don’t have many insights, but around 80% of users expressed that their recent experience was positive, and 50% would recommend StreamYard, with the other options split similarly.